Raman chocolate quality analysis reveals surprising insights into the texture and taste of chocolate Santas. Discover how Raman microscopy can help you choose the best festive treat for your loved ones.
Raman microscopy is known as a trusted ally in a variety of applications. From finding asbestos in our homes, to detecting life on other planets. Today, however, we will use Raman microscopy to check a beloved Christmas treat: the chocolate Santa Claus. Chocolate Santas are the sweet symbol of Christmas cheer. They offer a delightful combination of flavor and visual appeal making children’s and adult’s eyes sparkle with joy.
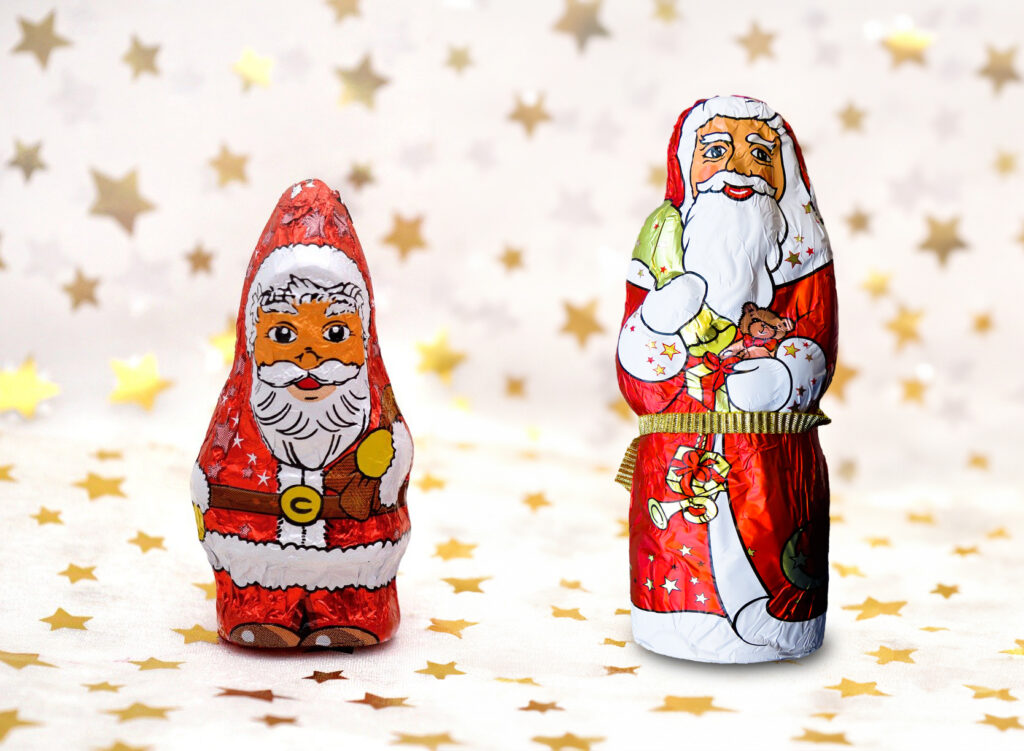
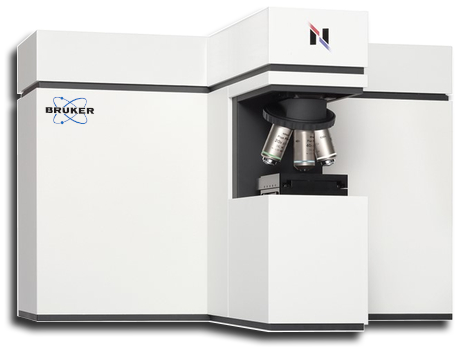
But not all chocolate Santas are of the same quality. To make sure that you only chose the best Santa Claus for your loved ones, we set out to compare two chocolate Santas from different manufacturers using our RAMANTouch Microscope.
Raman chocolate quality analysis
Raman spectroscopy can provide in-depth insights into the molecular makeup of chocolate, and it is surprising what a wealth of information it can give us about its composition, texture, and taste.
Both Santas basically consists of the same key ingredients e.g. lactose, milk fat, sucrose, and protein. But looking a bit closer several differences become apparent.
Raman microscopy
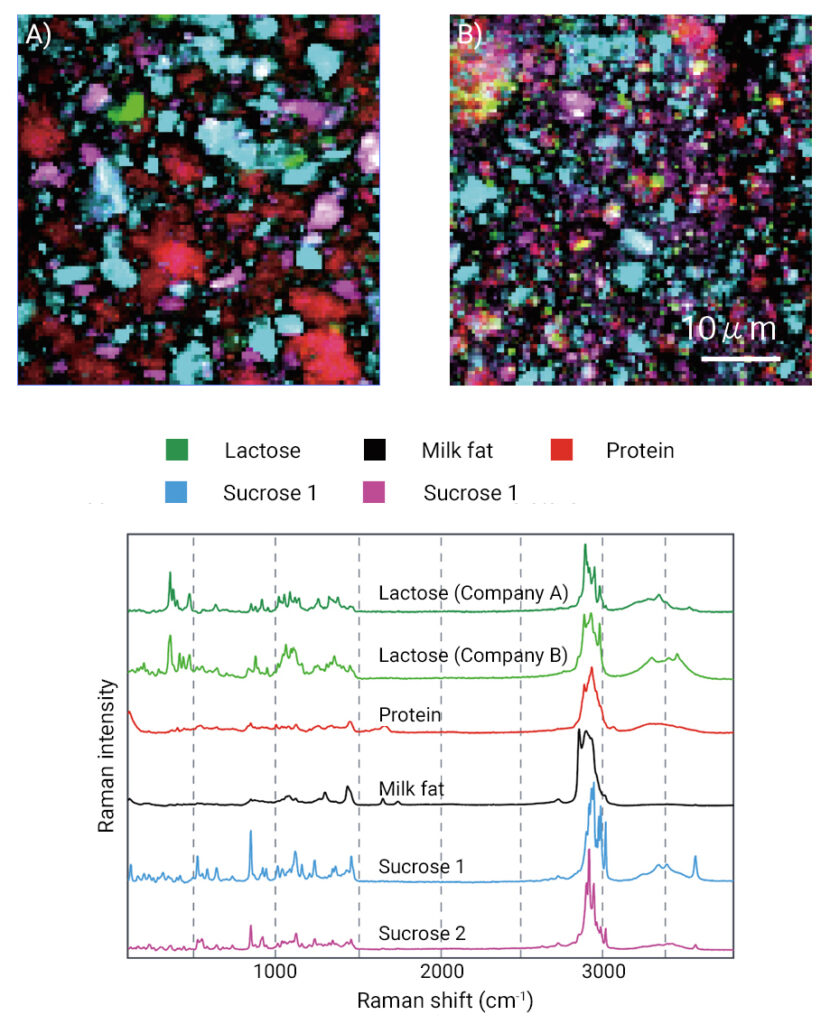
Image A (top left) shows the Raman imaging of the Santa from Manufacturer A, the one on the right the Santa of Manufacturer B. Lactose is depicted in green, milk fat in black, protein in red, sucrose 1 in blue and Sucrose 2 in violet. Simply looking at the two images already shows significant differences. Namely the components in Chocolate A are much coarser grained than in Chocolate B. But is this important?
Yes, in fact, the crystal size of components in chocolate significantly impacts its texture and taste. Smaller crystal sizes, like those found in Manufacturer B’s chocolate, create a smoother texture and a creamier mouthfeel. That is, because finer particles melt more evenly on the tongue. This uniform melting enhances the release of flavors, providing a richer and more balanced taste. In contrast, larger crystals, like in Chocolate A, can result in a grittier texture, which may diminish the overall sensory experience. Also, chocolate B has a lower protein content implying that less milk powder was used. This enhances the quality by contributing to a smoother, more refined texture.
Another difference that becomes apparent upon further analysis of the Raman images, is that sample B contains more Sucrose than sample A. So, while Chocolate Santa B has an overall better and smoother texture it will also taste sweeter than Santa A. But that certainly is a matter of taste. All in all, Chocolate Santa from Manufacturer B would most likely be the winner under the Christmas tree.
Conclusion
Raman microscopy has given us a unique perspective on chocolate Santas. By revealing the differences in texture and taste, we can better appreciate the quality of our festive treats. This technique shows how even small variations in ingredients can impact the final product. So, as you indulge in your holiday sweets, know that there’s more to your chocolate Santa than what meets the eye.
If you want to know more about the RAMANtouch have a look at this article about how Raman aids in Asbestos detection.


